INTRODUCTION
The tumor is heterogeneous that consists of multiple cell types [1]. The primary cause of tumor which includes environmental conditions, genetic factors manifested by stress, infection, or local injury [2,3]. The complexity and heterogeneity of the tumor a rise that is contributed by variation in the type, number and frequency of the somatic mutation [4]. Multiple types of tumor therapy have been the focus of tumor researchers [5-9] and the limitations of these approaches have been reported for the recurrence of the tumor after the primary treatment (PT) [10]. For convenience, the literature reviewed here is restricted to then on-blood solid tumor. The diverse nature of the tumor tissue with its heterogeneous cell types responds differently to the treatment process. The responsive groups have been assigned as drug-sensitive cells (DSCs)while on-responsive cells are defined as drug-resistant cells (DRCs) [11] or phenomenon identified as drug re-sensitivity (DR) [12].
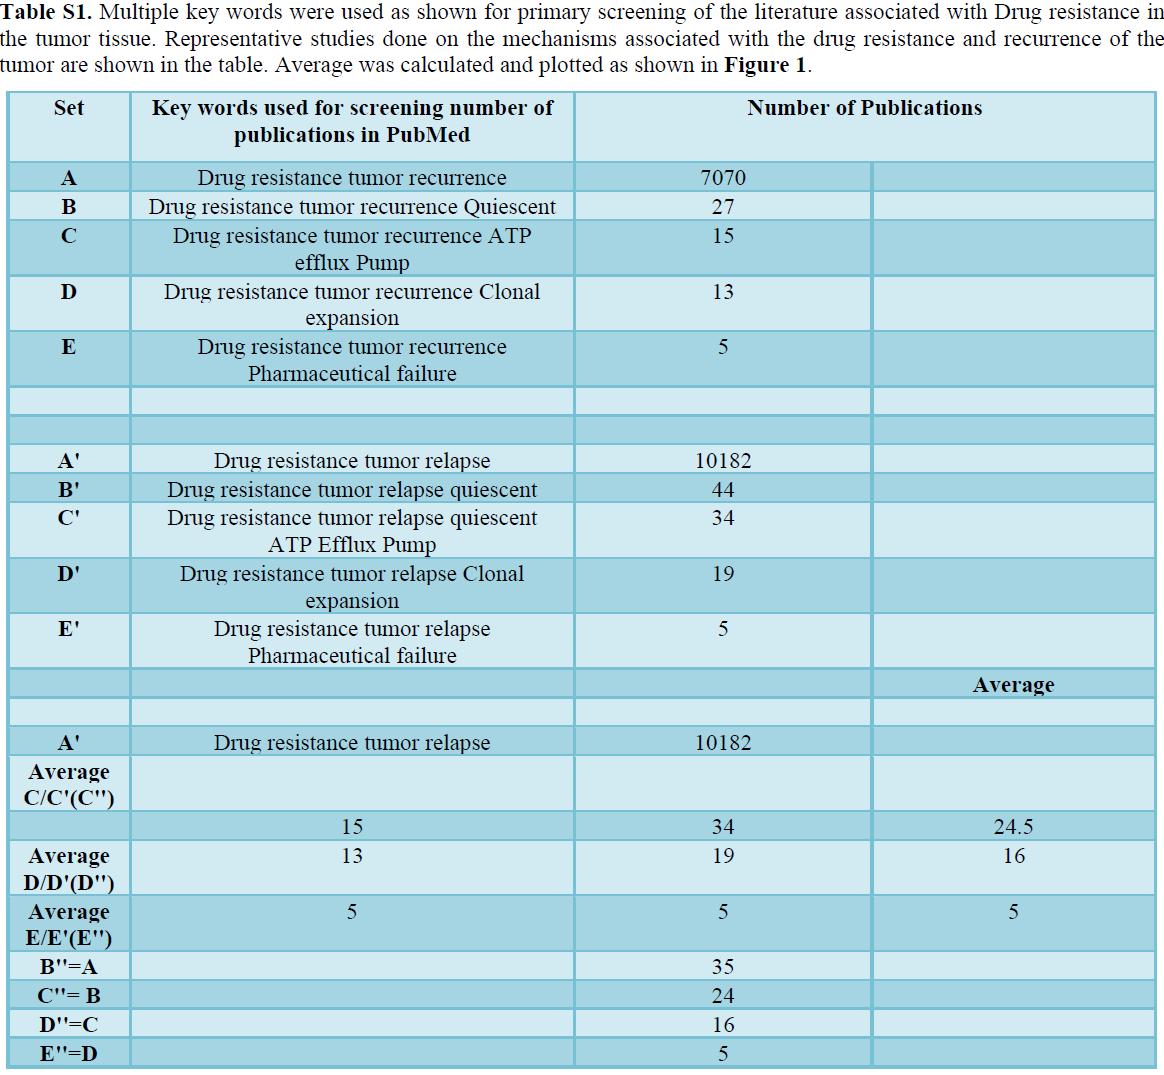
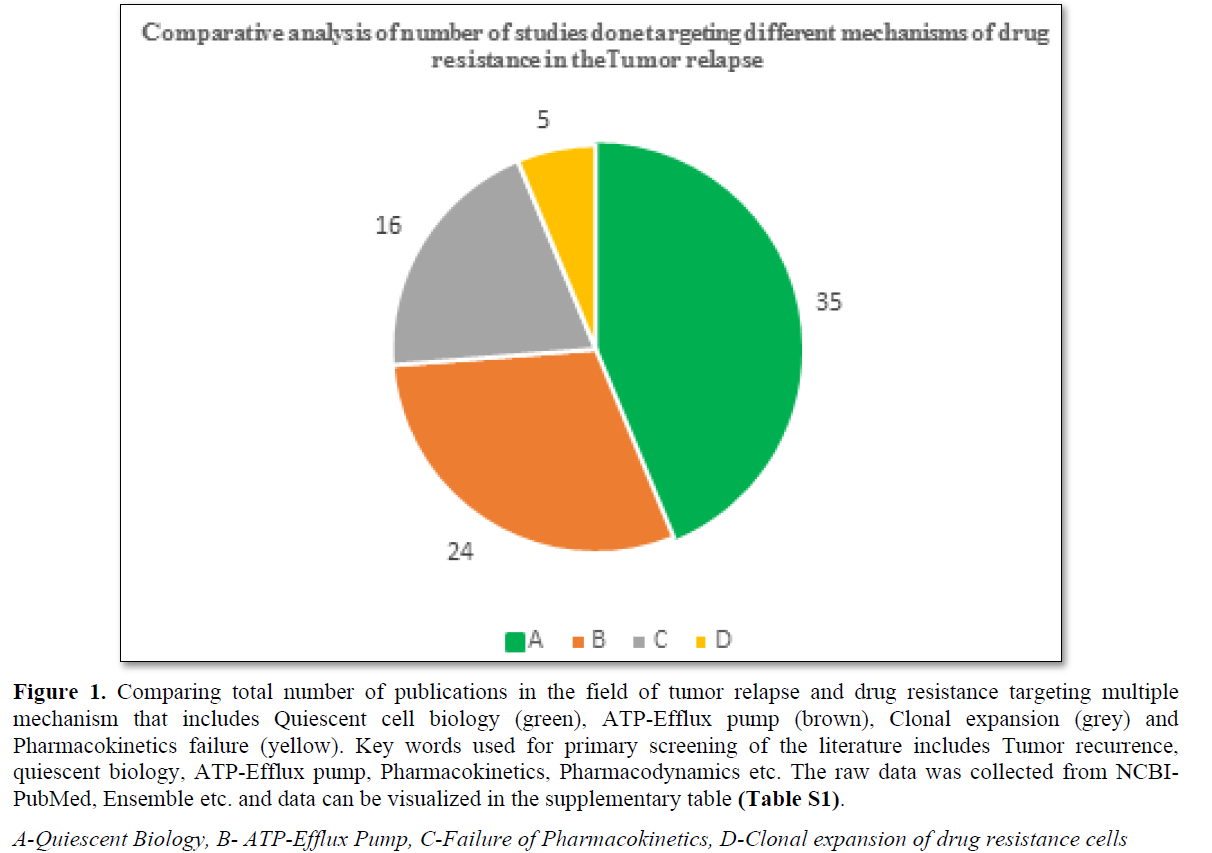
90% tumor-related death has been reported due to the drug resistance and unproductiveness of the treatment [13-16]. Mechanism associated with DRCs include pharmacokinetics failure, ATP-Efflux pump, clonal expansion of resistance cells, and cell cycle dynamics (G0 transition to G1) [1-5] (Figure 1 and Table S1). The DR in the solid tumor cells based on the cell cycle dynamics (G0) and its role in the recurrence of the tumor is the focus of the present review.
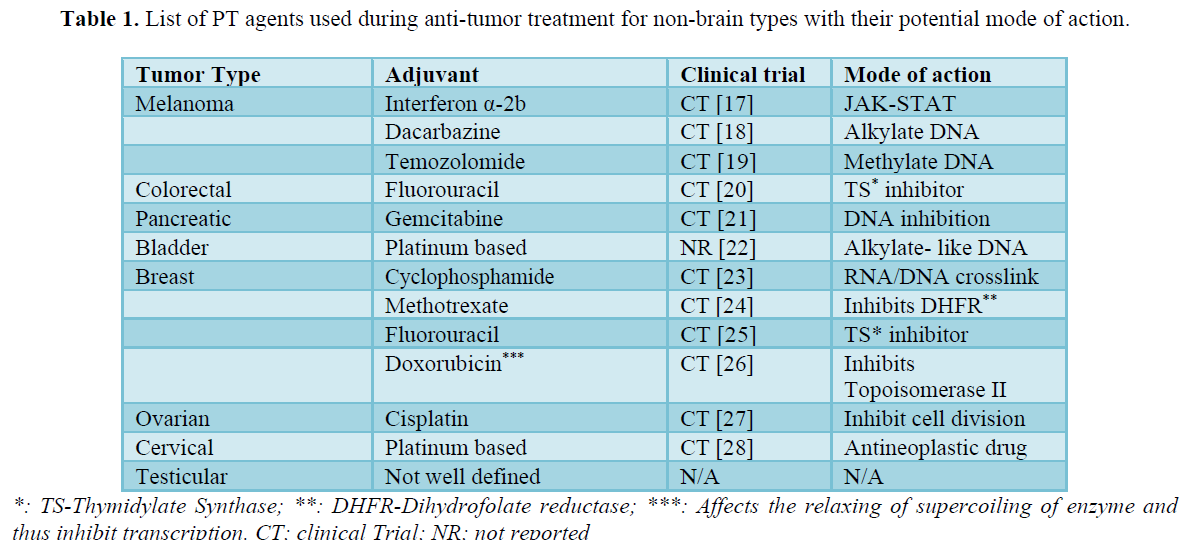
The cell cycle consists of multiple mini steps of G1, S, G2 & M that is involved in the cell division [6] and DNA replication. An additional state that exits outside the cell cycle (quiescence-G0) that are neither dividing or nor synthesizing DNA but remains metabolically active and considered as a distinct phase of the cell cycle [7]. The G0 cells have been categorized as DRCs and are responsible for the recurrence of the tumor [4,8] among other possible mechanisms mentioned above. It has been suggested that once the treatment for the cancer therapy is over, the drug resistant G0(DRC) undergoes the transition to the G1 and/or in the process contributes to the recurrence of the tumor [9]. In the field of tumor therapy, there is a need for identifying agents that can sensitize the DRC(G0) to the drug-sensitive proliferative state and in the process eradicate the reservoir for the generation of cells contributing to the recurrence process during the post-PT [6]. In this context, it is important to mention that for the effective management of the tumor therapy, the process has been classified into two steps-the PT consists of drugs that induce apoptosis [6], inhibits protein and/or DNA synthesis/replication and thus affecting host cells translation/transcription in the multiple levels [7-9]. The mechanism mainly targeted by these drugs are microtubule dynamics affecting cell division along [10,11] with the use of alkylating/methylating agents [12,13] (Table 1).
The focus of the present. Review is Neo-Adjuvant Therapy (NAT) [14-16,29] especially chemotherapeutic (C) part of the NAT that is focused on the relapse of the tumor tissue (NACT). The most common form of NAT (non-chemotherapy) used is surgery and irradiation that is still relevant in the management of solid tumor therapy that may be pre-operative or post-operative [30-33]. The NAT aims to eliminate the residual tumor cells that are not accessible by the primary treatment (PT). Moreover, it should prevent there-establishment of the tumor or the relapse after the PT course is stopped. There is a requirement for improving the existing NAT to be used against solid tumors specially chemo- NACT as very few of them are focused on the G0DRCs [6,7]. The process of identifying, screening and investigating potential NACT agents should fulfill one critical criterion -the DRCs(G0) should be sensitized to undergo cell cycle entry viaG0-G1 transition before PT. In preparation for predicting and proposing potentially novel NACT agents against tumor recurrence, it is very crucial to understand the cell biology of G0 cells and mechanisms that can be manipulated for the artificial transition of (G0) to the (G1 phase). The genome and cell cycle dynamics of Saccharomyces cerevisiae is relatively well conserved with that of the mammalian cell cycle [7,8]. Using literature review on cross-species comparison of cell cycle dynamics across multiple species, the following concerns were raised that are as follows-
- Is there any reporter assay available that can track the duration of the G0 phase and monitor the effect of
drugs/Inhibitor on the G0 dynamics?
- What is the genomic information (promotor analysis, motifs, enhancers, microRNA etc.) one should have to make an appropriate G0-specific reporter construct?
- Can we use already available drugs (pro-proliferative factors) that have the potential to induce G1 entry?
- It is of importance to note that among all the known mechanism associated non-responsive of the tumor to PT, the review focusses on the drug resistance originating because of quiescent cells.
Materials & Methods
Literature review
PubMed, Uniport, Ensemble, UCSC databases was used to identify publication related to Tumor recurrence, drug resistance and quiescence biology.
In silico analysis-Sequence analysis
Blast, BlastP, Smart Blast, EMBOSS Needle, Blat was used to align the RNA and Protein sequence. Promotor analysis to identify Transcription factor binding site-Augustus version [8] for promotor analysis and PROMO from TRANSFECTS. Micro RNA Regulatory Element identifier Target Scan Human was used for the identification of MREs along with sequence-specific comparison of micro RNA target site in the 3’UTR of GOS-2 gene.
Gene Enhance locator
The potential enhances relementin 5’UTR was examined during UCSC genome browser and Eukaryotic Promotor Database.
Conserved domain analysis
The software like CCD in NCBI, InterPro in EMBL-EBI was used for identifying con- served domains in the protein’s primary structure.
Restriction digestion mapping
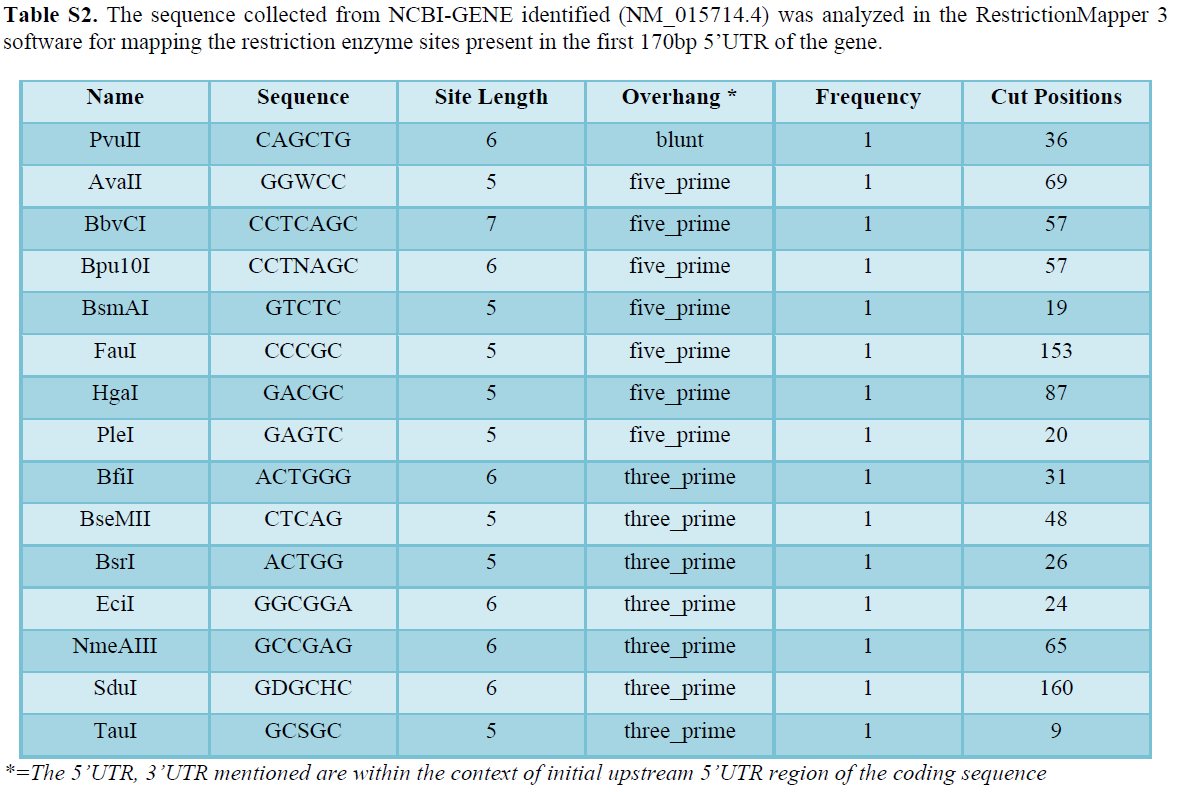
GenScript, Restriction mapper 3 software were used for mapping the restriction enzymes sites in both promotor region of the GOS-2 gene as well as coding region of the GFP (Table S2).
Insilico Primer designing
Primer 3 and Primer-Blastin NCBI was used for designing gene specific primers from different regions of the genome (Table 4).
Generation of restriction site in the primers specific for GOS-2 (5’UTR/CDS) for GOS-2 transcriptional assay
The primers are designed following the standard guidelines of 5’UTR-sitting sequence (4 nucleotide), restriction site (6 nucleotide) and GOS2 specific sequence. Kp1 and EcoR1 restriction digestion sites were added in the respective 5’UTR/3’UTR of the GOS2 specific primer. The generation of restriction sites with PCR were then digested with both the restriction enzymes and subsequently ligated to the vector (pPD95.75). For Kp1 (438bp) RE, GOS2-F-5’- AGGGT-GGTACC-GAGAGGAGGAGAACGCTGAG - 3’ and for EcoR1 (1012bp), GOS2-R-5’-GGCGGC-GAATTC-CTCTCGGAGGCGGGAATG - 3’ was used using Primer 3 software.
Repeat masker analysis
In order to avoid repeats within the PCR amplified regions of the template, Repeat-Masker software was used.
In silico PCR
Using In silico PCR facility in UCSC genome browser, the primer designed were used to perform Insilico PCR.
Tissue culture
Mammalian breast cell culture line was maintained according to the standard procedure namely Hela and MDAMB231celllines [9].
Transduction of viral construct (FUCCI) in the cell lines
FUCCI plasmid with its G1 specific Cdt1-RFP fused protein along with M-G2 specific Geminin-GFP protein is introduced in the cell lines during the proliferative phase of the cell cycle. The technology is called as FUCCI (Fluorescence ubiquitination cell cycle indicator (FUCCI), a translational reporter assay where genes are do unregulated by the ubiquitination process [10,11]. The expression of Cdt1-RFP showing red fluorescence indicates cells in G1 phase of the cell cycle and expression of geminin-GFP showing green fluorescence indicates G2 phase of the cell cycle [12]. It’s an advanced biomedical technique to monitor the individual stages of the cell cycle under live condition using fluorescent microscopy.
Premo FUCCI Cell Cycle Sensor BamMam 2.0
The two viral vectors consist of Premo gemin in-GFP and Premo Cdt-1-RFP were introduced separately into the Hela and MDAMB231 cell lines as previously described [13]. The two constructs were mixed prior to adding the solution in the cell lines. 40ul of Premo Geminin-GFP is added to the 2 ml of culture medium (DMEM) in 12 well tissue culture plate. Cell culture medium was replaced with 2 ml of transduction solution and cells were incubated for 2 h at 37ºC. Additional enhancer solution provided in the kit (1X BacMam) was mixed with fresh medium and finally added to the cells for further incubation at 37ºC. Fresh medium was given to the transduced cells followed by 16 h incubation at 37ºC.
Imaging with Spinning Disc fluorescent microscopy
The transduced cells under the influence tryps in gets detached from the cell culture plate and after 20 h transferred to 35 mm glass bottom tissue spinning Disk 2.6-Image Processing Software-Image J and Photo shop and movies were made using Xen-blue/black software. Time lapse images were captured after regular time point with the automatic setting parameters which attached to a colored camera. The imaging continued for 72 h post-transduction.
FACS analysis
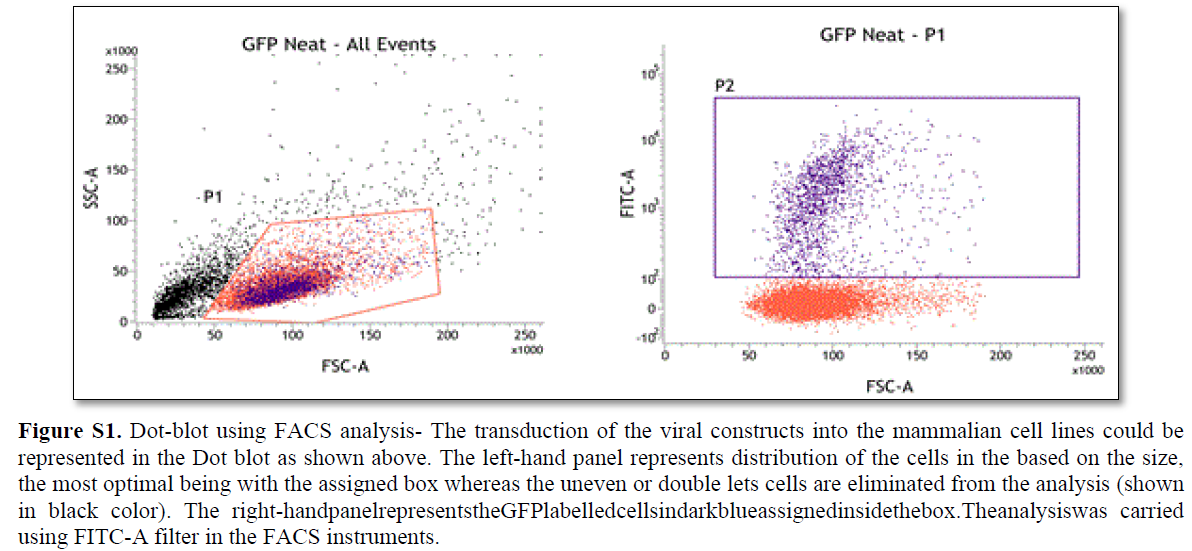
In order to study the successful transduction efficiency of the Fluorescent probes in the cell culture, FACS analysis was performed as described earlier [14]. The minimum of 50% transduction efficiency was used as a threshold in FACS analysis that was further processed for the visualization under microscopy (Figure S1).
RESULTS
Cell cycle detection visualization and associated functional drug assay using molecular markers fused to are porter gene has been described in the literature [15,16]. The identification of different stages of cell cycle is done using markers in G1 (Cdt-1-RFP-red) and G2 phase (Geminin-GFP-green) of the cell cycle [4,12,15]. However, there is a gap in the information regarding visualization and identification of the quiescent cells (G0) for downstream functional analysis. Neither any transcriptional/translational reporter assay associated with the quiescent specific cells have been documented nor any gene editing tool targeting quiescent cells have been described. In order to select appropriate gene reporter system for understanding quiescent cell biology, it is of critical importance to understand and study the regulatory elements associated with the 5’UTR and 3’UTR of the gene related to G0/G1 transition process.
In silico synthesis of G0 specific transcriptional GOS 2-GFP fusion reporter
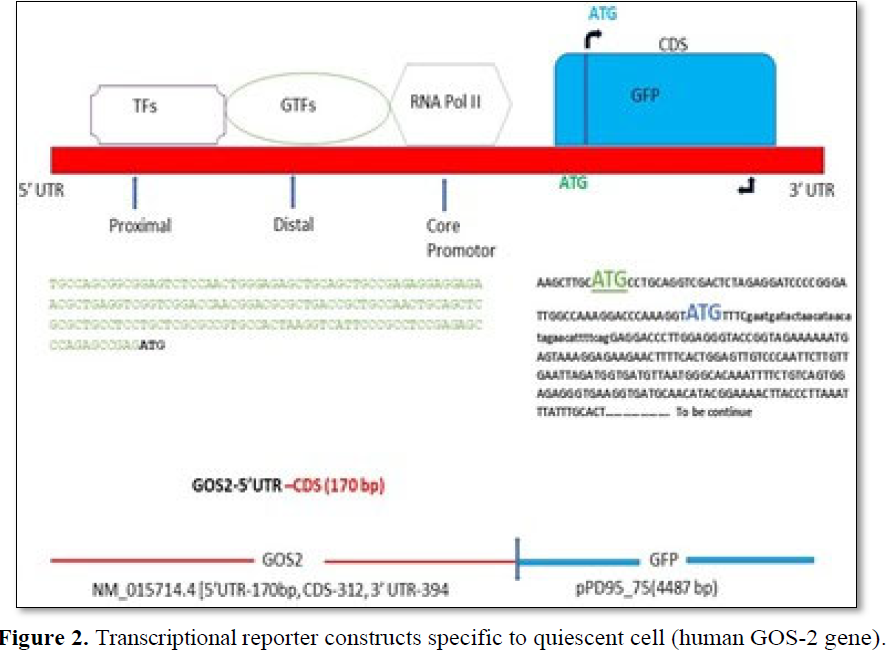
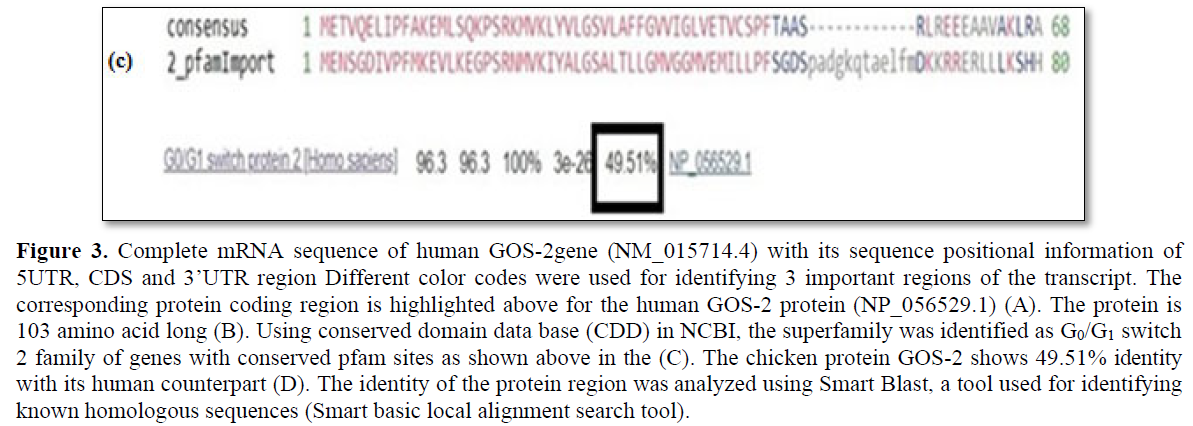
Using PubMed, Ensemble and UCSC genome browser, a total of 6 genes have been screened that shows high level expression in the G0 phase of the cell cycle and its down regulation is accompanied by transition to the G1 phase (Table 2). G0/G1 switch - 2 (GOS-2) first identified in chicken, a protein coding gene with multiple function in the apoptotic pathway and lipid metabolism [29,30]. In silico sequence analysis shows human GOS-2 gene is 876bp long with 5’UTR-170bp, CDS-312bp, 3’ UTR-394bp along with positional sequence information of the initiation codon (Figures 2 and 3). The human GOS-2 translated protein is 103aa long and using Smart BLAST analysis, it shows 49.51% identity with the chicken sequence (Figure 3c). Using conserved domain identifier (CDD) in NCBI, the gene has been clustered to the superfamily of G0_G1_switch_2 genes (Figure 3d).
In Silico synthesis of quiescent cell specific transcriptional reporter of Human GOS-2gene (hGOS-2-GFP). The genomic organization of the human GOS-2 genem RNA (NM_015714.4) fused to the coding region of the GFP. The fusion protein is a transcriptional reporter and hence only promotor region of the h GOS-2geneis considered for the analysis. The sequence was identified using UCSC genome browser that interactly visualize genomic data. The m RNA positional information was gathered by RNA fold software to identify the promotor, coding sequence and downstream 3’ prime region of the gene as shown above. The typical promotor consists of proximal, distal and core regions having binding sites for RNA polymerase (RNA Pol II},General Transcription Factors (GTFs) and tissue-specific Transcription Factors (TFs). The 5’UTR (untranslated region) of Human GOS-2sequence is shown on the left panel with its ATG initiation codon (Bold). The coding region of the GFP (C.Elegans) (as a part of vector pPD95_75 (Addgene)is used for the analysis. The sequence analysis of the GFP was identified from the publicly available web portal. ppD95_75 (AndrewFire-Addgeneplasmid#1494: http://n21.net/addgene:1494:RRID:Addgene_1494]. Analysis of protein sequence using CCD and Blast P shows pfam gene is the only other member of this superfamily (Figure 3d) that are known to be involved in apoptosis by preventing the complex formation of BAX-BCL2 protein [29]. As a proof of concept to design a reporter assay specifying, marking and visualizing G0 phase pf the cell cycle, GOS-2 gene sequence was selected based on its role in the transition process from G0 to G1 (Table 4). For the In silico synthesis of the transcriptional reporter (GOS2-GFP), promotor region of the human GOS2 (NM_015714.4) was used along with the coding region of the GFP (pPD95_75) [31].
- 4 – 876 bp G0/G1 switch protein 2 [Homo sapiens] [5’UTR-170bp, CDS-312bp, 3’ UTR-394bp
TGCCAGCGGCGGAGTCTCCAACTGGGAGAGCTGCAGCTGCCGAGACCAACGGACGCGCTGACCGCTGCCAACTCAGCTGCTG
CCTCCTGCTCGCGCCGTGCCACTAAGGTCATTCCCGCCTCCGAGAGCCCAGAGCCGAGATGGAAACGGTCCAGGAATCC
CCCTGGCCAAGGAGATGATGGCCCAGAAGCGCAAGGGGAAGATGGTGAAGCTGTACGTCGTGGTGCTCGGGGAGAC
TGTGTGCAGCCCCTTCACGGCCGCCAGACGTCTGCAGCCGTGGCGGAGCTGCAGGCCGCCCTGGAGCGACAGGAGAAGC
AAGCCCTGCAGGAGAAAGGCAAGCAGCAGGACACGGTCCTCGGCGGCCGGGCCCTGTCCAACCGGCAGCACGCCTGGAA
CTGTGGGAGACCAGCGGAGTGGGAGGGAGACGCAGTAGACAGAGACAGACCGAGAGAGGAATGGAGAGACAGGGG
CGCGCGCACAGGAGCCGACTCCGCTGGGAGAGTGCAGGAGCACGTGCTGTTTTTTATTTGGACTTAACTTCAGACCGC
TGACATCTAGAACTGACCTACCACATCCACCAAAGGAGTTTGGGATTGAGTTTTGCTGCTGTGCAGCACTGCATTGTC
ATGACATTTCCAACACTGTGTGAATTATCTAAATGCGTCATTTTGCACTAGGGAGGAAGGATAAATGCTTTTTATGTTA
TTATTAATTATTACAATGACCA
- 1 – 103aa G0/G1 switch protein 2 [Homo sapiens]
METVQELIPLAKEMMAQKRKGKMVKLYVLGSVLALFGVVLG
LMETVCSPFTAARRLRDQEA
In silicosynthesis of quiescent specific (G0) translational reporter fused with the GEP
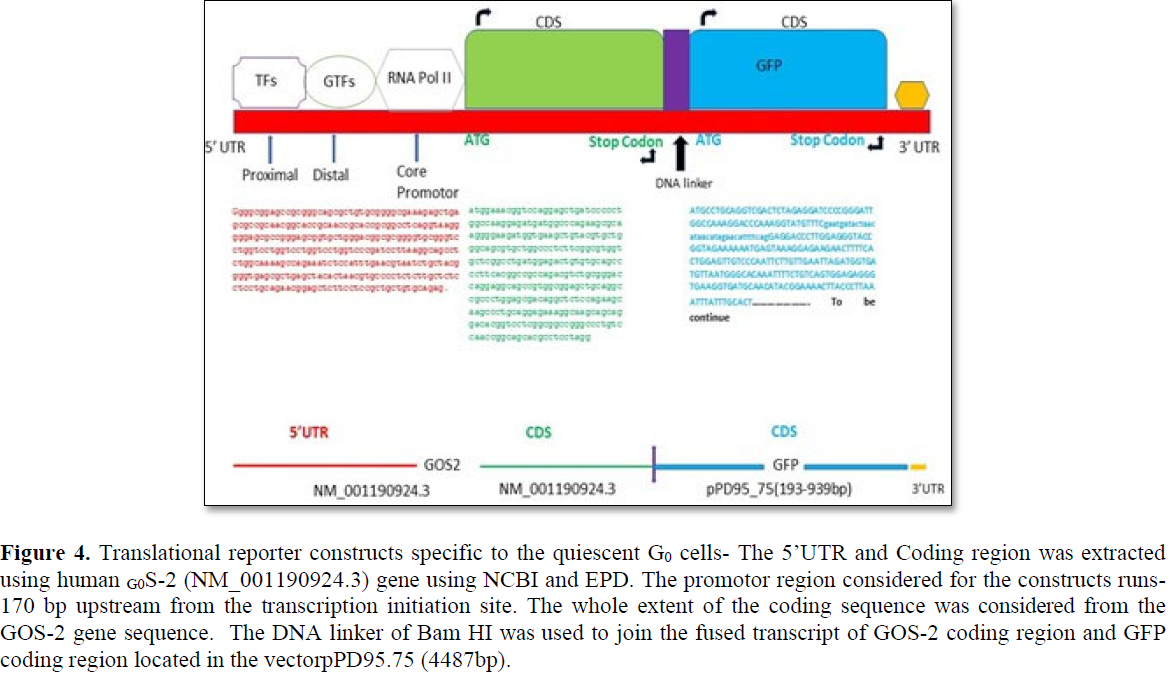
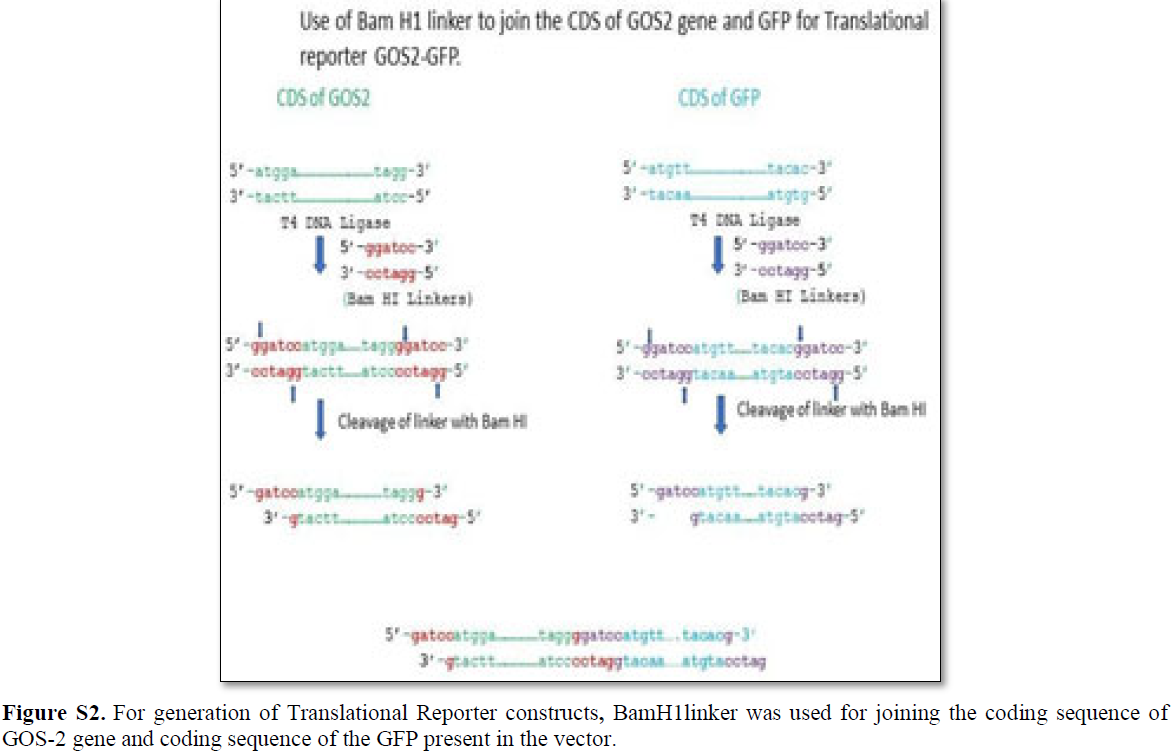
The translational reporter system gives much better resolution in terms of expression profiling and subcellular localization with additional features of 3’UTR associated post- translational modification [32]. Multiple ways translational reporter system could be synthesized and in the present review, the proposed construct consists of 5’UTR/promotor of gene of interest (GOS-2) followed by the coding sequence of GOS-2 and coding sequence of the reporter (GFP) with 3’UTR extension (Figures 4 and S2). For the generation of the translational reporter construct, 170 bp upstream of the TSS are considered for the In silico analysis. The DNA linker used for the fusion of the CDS of GOS-2 gene and GFP gene present in the vector (pPD95.75) that was done by using Bam HI DNA linker (Figure S2).
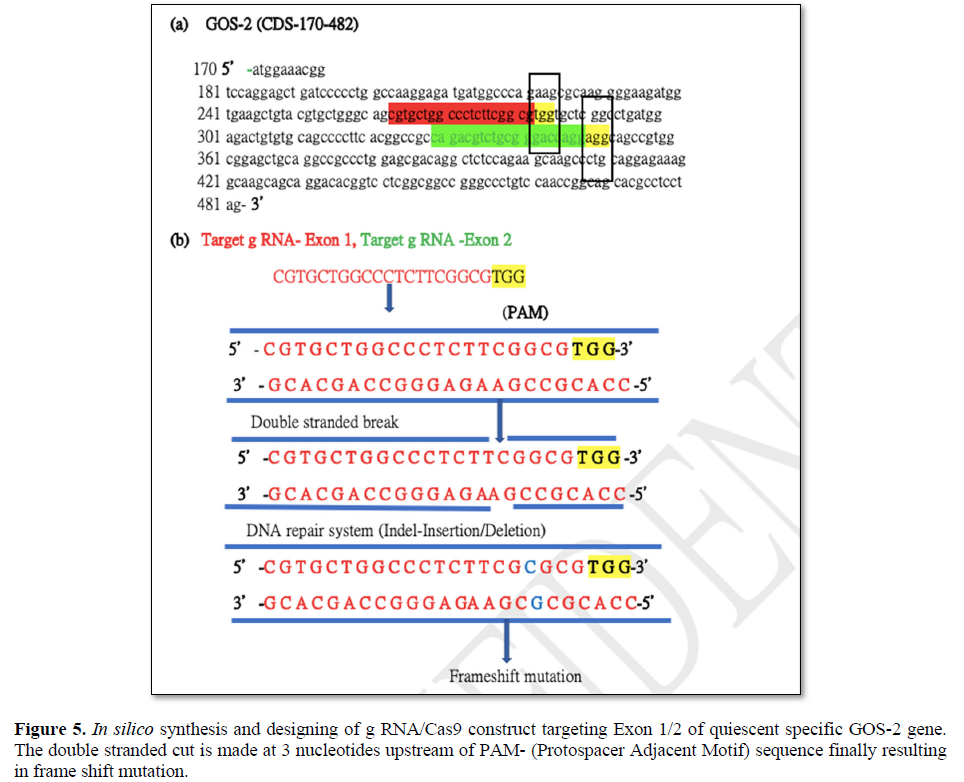
In silico synthesis of gene editing tool of gRNA/C as 9 constructs targeting G0 specific quiescent specific GOS-2 molecular marker
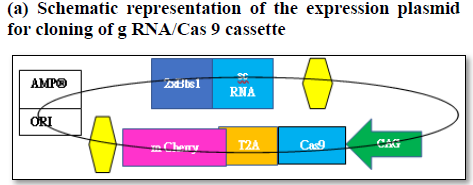
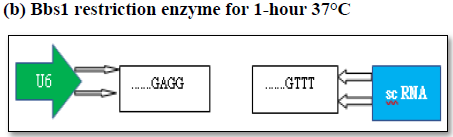
Targeted gene editing using gRNA/Cas 9 has been extensively used in the field of genome manipulation [33]. It is a genome editing tool using guide RNA (gRNA)and scaffold RNA (scRNA)to identify target sequence of 20 nt long to generate double stranded cut by Caspase 9 enzyme [40]. The activation of the DNA repair mechanism contributes to insertion or deletion of nucleotides in the target sequence finally resulting in the frame shift mutation [40]. In the present scope review, Ex on 1 and Ex on 2 was used a sagRNA target construct that runs from 263-282 bp and 329-348 bp of GOS2gene (NM_001190924.3) respectively. The PAM (protospacer adjacent motif) sequence for both the g RNA/Cas9 system are TGG (283-285bpposition) &AGG (348-351bpposition) immediate downstream of gRNA sequence belonging to Ex on 1 and Ex on 2. The gRNA/Cas9 makes a double stranded cut of 3 nucleotide upstream of the PAM sequence in 279 and 346 position respectively. The DNA repair mechanism would try to amend the double stranded cut and, in the process, generating frameshift mutation that finally affects the function of the gene (Figures 5 and 6). The plasmid pSpCas (BB)-2A-GFP(PX458) is digested by 2XBbsl to generate overhangs followed by the synthesis of the sense and antisense g RNA oligos with 5’ & 3’ 2XBbsl overhangs that complement the vector overhang (Figures 6a and 6b). Typical DNA ligation with T4 DNA polymerase and subsequent transformation and cloning into the bacterial cell (Figures 6c and 6d). Extraction and purification of the plasmid for downstream functional analysis along with microscopy and phenotypic analysis are among multiple approaches that could be exploited to in order to study quiescent biology and G0/G1transition.
Promotor analysis of G0-speciftc Human geneG0S2
Identification of several motifs in the upstream -1000 to 100 bprelative toTSS.
Eukaryotic Promotor data base was used for identifying upstream 5’UTR region of the quiescent G0-specific GOS2 gene in Human (NM_015714.4). Sequence retrieval tool was used to extract the promotor sequence-2000bp upstream relative to TSS (Figure S3). Promotor motifs were identified using search motif tool in the library from-1000 bp to100 bp of the TSS. The two TATA-box were identified at -664bp and-29 bp position relative to TSS with an initiator at-402 position. GC-boxin-47position followed by the presence of another Gcbox with in the first cod on at position 8 downstream of TSS. Moreover, two CCAAT-Box at position -587 bp and -547bp is present relative to the TSS.
Computational prediction of transcription factors binding site associated with the promotor region of G0- specific gene (GOS2) using PROMO virtual laboratory
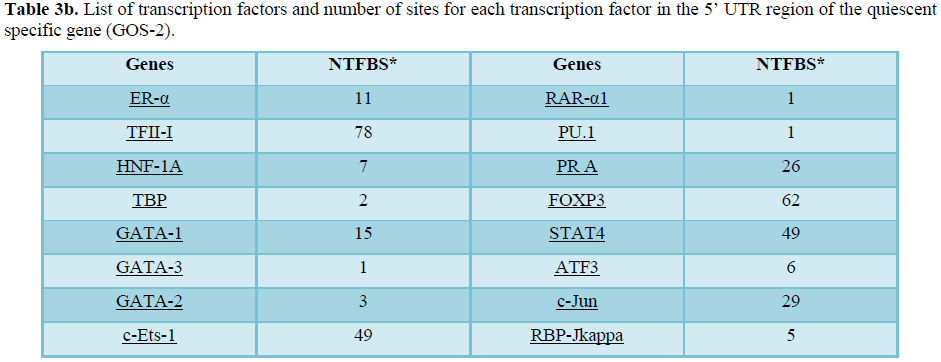
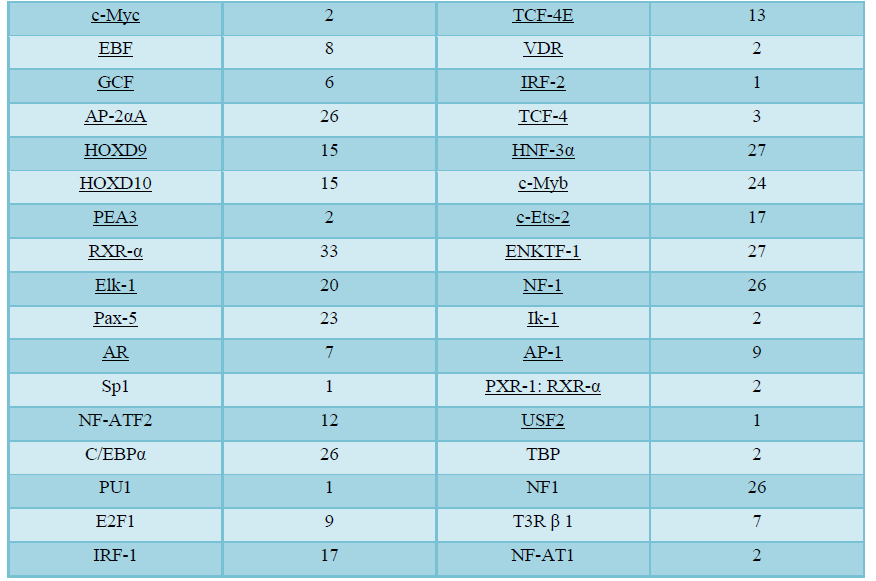
Using PROMO virtual laboratory, prediction of the potential transcription binding sites was analyzed encompassing-3000bp to 0bprelative to TSS with dis similarity margin of less or equal to15%. 81 different types of transcription factors binding site has been identified with human quiescent specific GOS-2 upstream promotor sequence (NM_015714) relative to the TSS (Table 3). Among the predicted transcription factor binding site identified in the promotor region of the quiescent cell specific geneGOS-2gene in the present analysis, some are general transcription factors or while others are involved in the specific transcriptional program like HOXD9/HOXD10 (Table 3). On the detail analysis of transcription factor binding site, it was observed that there is lot variation in the number of potential binding sites associated with some transcription factors like C/EBP-βand RAR-α1 are 113 and 1 respectively (Table 3).
The plasmid pSpCas (BB)-2A-GFP(PX458) is digested by 2XBbsl to generate overhangs followed by the synthesis of the sense and antisense g RNA oligos with 5’ & 3’ 2XBbsl overhangs that complement the vector overhang (Figures 6a and 6b). Typical DNA ligation with T4 DNA polymerase and subsequent transformation and cloning into the bacterial cell (Figures 6c and 6d). Extraction and purification of the plasmid for downstream functional analysis along with microscopy and phenotypic analysis are among multiple approaches that could be exploited to in order to study quiescent biology and G0/G1 transition.
(c) Generation of sticky end with 2x Bbs1 enzyme
[Sticky end g RNA sequence (Exon2, GOS-2]
Sense Oligo: 5’-CACCCAGACGTCTGCGGGACCAGG-3’
Antisense Oligo:3’ GTCTGCAGACGCCCTGGTCC-CAAA-5’
[g RNA reverse complementSticky end]
(d) Mix oligo to form duplex-950C
5’-CACC C A G A C G T C T G C G GG A C C A G G
G T C T G C A G A C G C CC T G G T C CCAAA-5’
(g) Ready for all sorts of functional analysis to check for mutation, subcellular location, gene expression profiling, phenotypic affect, toxicity assay etc.
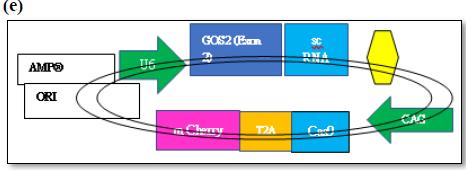
Figure 6a. The expression vector (pSpCas9(BB)-2A-GFP- (PX458) consists of Cas9 enzyme in frame with m Cherry fused by T2A linker driven by CAG promotor and expression of g RNA (GOS-2-Exon 2)/sc RNA driven by U6 promotor. Schematic representation of the expression factor (a), restriction digestion site of the vector (b), generation of sense/antisense oligos (c), mixing of oligos (d)
Figure 6b. (e) Subcloning of GOS2-Exon-2 g RNA oligo duplex sequence (f), transformation in bacterial cell, (g) Cloning, extraction of plasmid followed by functional analysis.
In silico identification of potential enhancer region in the quiescent specific GOS-2 gene
The combination H3K4me1 and H3K27AC positive regions in the regulatory sites has been used extensively for identifying enhancers [41]. Using UCSC genome browser and EPD, covering -3000bp relative to the TSS, 5 regions in the genome of the GO-specific GOS-2 gene has been identified using the characteristic feature of H3K4me1 and H3K27AC positive region in the regulatory sequence of the gene of the interest (Figure 7). Five regions have been highlighted that could have the potential for finding the enhancer element associated with quiescent specific GOS-2 gene. This information would be a good tool to understand the regulation of gene expression during G0/G1 transition process.
Target prediction of microRNA Regulatory Elements (MREs) in the 3’UTR region of the G0-specific GOS-2 gene
In order to find potential microRNA regulatory elements, present in the 3’UTR region of the GOS-2 gene, the NCBI and Ensemble reference sequence used for the 3’UTR analysis are NM_01574.4 and ENST00000367029.4. The sequence position of 482-876bp in NM_01574.4 is equivalent to 1-394bp analyzed for the identification of potential mi RNA in the Target Scan Human software. All the miRNA sites recognized in the 3’UTR are having 7mer-m8 sites (Figures 8a and 8b).
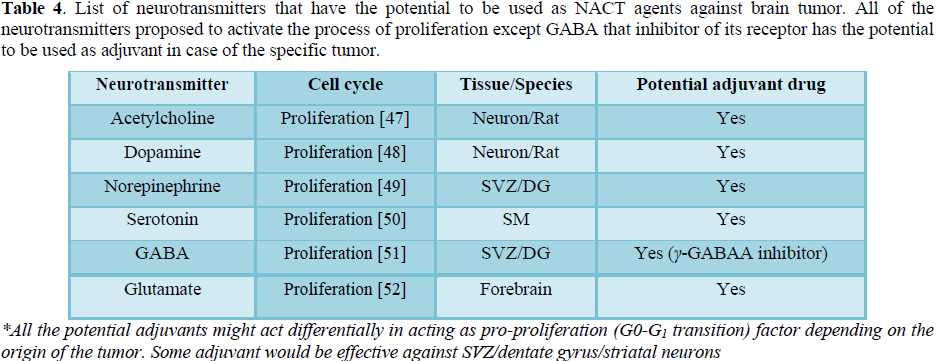
Pro-proliferating Drugs that has the potential to be used as G0/G1 transition agent NACT agents or against brain cancer
As the recurrence of the solid tumor is most prevalent in the case of brain tumor as compared to the other types of tissue relapse [44-46], the known pro-proliferating agents that are generated in a spatiotemporal restricted manner and secreted in brain would have the maximum chance of inducing transition in the neuronal quiescent cells to enter the cell cycle and in the process transitioning DRCs to DSCs (Table 4).
The generation of neurotransmitters are site specific as some of them have function in subventricular zone while others having role in the ventral forebrain involved in the process of cell proliferation (Table 5). It indicates the use of these potential NACT agents against specific tumor has to be taken into consideration depending on the site of their origin for their effectiveness.
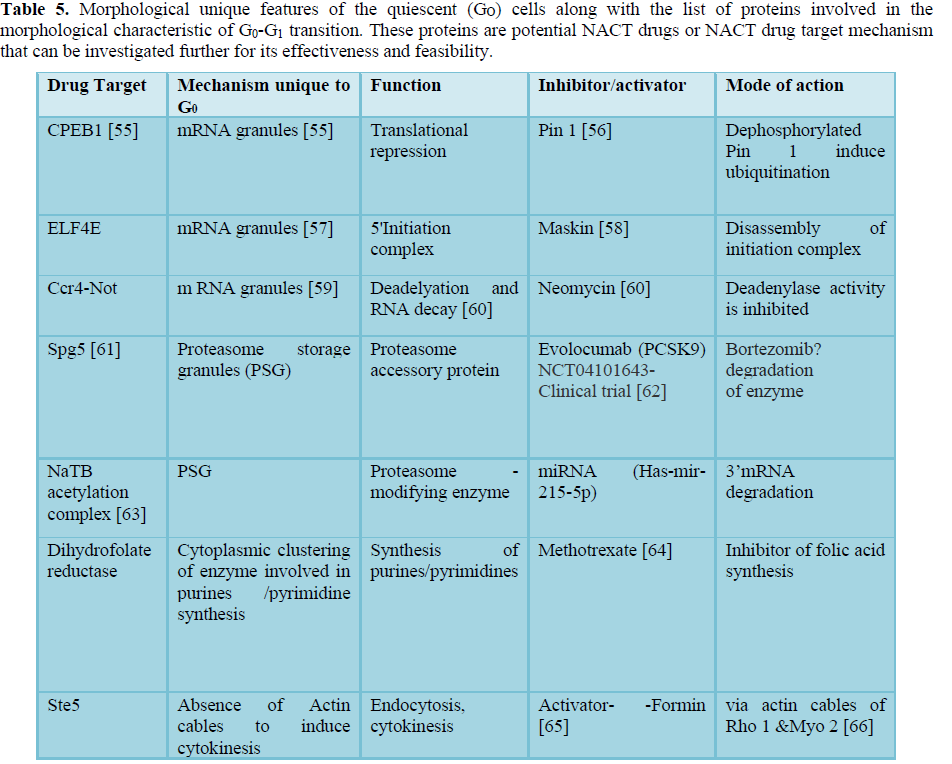
Identification of the cellular mechanism predicted to be used as a target mechanism for designing NACT drugs against drug resistant cells.
The transition of cell fate is associated with not only molecular dynamics but morphological deviations during the process [53]. The subcellular re-organization of G0 cells associated with its transition to G1 phase have been investigated in detail including presence of G0 unique morphological features like mRNA granules of P-bodies, proteasome storage granules (PSG) etc. [53,54]. These molecular events unique to G0 phase that coincide with activation or repression of certain genes could be examined as a potential NACT drug development strategy (Table 5).
Materials and Methods
Literature review: PubMed, Uniport, Ensemble, UCSC databases was used to identify publication related to Tumor recurrence, drug resistance and quiescence biology.
In silico analysis-Sequence analysis
Blast, BlastP, Smart Blast, EMBOSS Needle, Blat was used to align the RNA and Protein sequence.
Promotor analysis to identify Transcription factor binding site
Augustus version [8] for promotor analysis and PROMO from TRANSFECTS.
Micro RNA Regulatory Element identifier
Target Scan Human was used for the identification of MREs along with sequence-specific comparison of micro RNA target site in the 3’UTR of GOS-2 gene.
Enhancer locator
The potential enhances relementin 5’UTR was examined using UCSC genome browser and Eukaryotic Promotor Database.
Conserved domain analysis
The software like CCD in NCBI, InterPro in EMBL-EBI was used for identifying con- served domains in the protein’s primary structure.
Restriction digestion mapping
GenScript, Restriction mapper 3 software were used for mapping the restriction enzymes sites in both promotor region of the GOS-2 gene as well as coding region of the GFP (Table S2).
Insilico Primer designing
Primer 3 and Primer-Blastin NCBI was used for designing gene specific primers from different regions of the genome (Table 4).
Generation of restriction site in the primers specific for GOS-2 (5’UTR/CDS) for GOS-2 transcriptional assay
The primers are designed following the standard guidelines of 5’UTR-sitting sequence (4 nucleotide), restriction site (6 nucleotide) and GOS2 specific sequence. Kp1 and EcoR1 restriction digestion sites were added in the respective 5’UTR/3’UTR of the GOS2 specific primer. The generation of restriction sites with PCR were then digested with both the restriction enzymes and subsequently ligated to the vector (pPD95.75). For Kp1 (438bp) RE, GOS2-F-5’- AGGGT-GGTACC-GAGAGGAGGAGAACGCTGAG - 3’ and for EcoR1(1012bp), GOS2-R-5’-GGCGGC-GAATTC-CTCTCGGAGGCGGGAATG-3’ was used using Primer 3 software.
Repeat masker analysis
In order to avoid repeats within the PCR amplified regions of the template, Repeat- Masker software was used.
In silico PCR
Using In silico PCR facility in UCSC genome browser, the primer designed were used to perform In silico PCR.
Tissue culture
Mammalian breast cell culture line was maintained according to the standard procedure namely Hela and MDAMB 231 cell lines [9].
Transduction of Viral construct (FUCCI) in the cell lines
FUCCI plasmid with its G1 specific Cdt1-RFP fused protein along with M-G2 specific Geminin-GFP protein is introduced in the cell lines during the proliferative phase of the cell cycle. The technology is called as FUCCI (Fluorescence ubiquitination cell cycle indicator (FUCCI), a translational reporter assay where genes are down regulated by the ubiquitination process [10,11]. The expression of Cdt1-RFP showing red fluorescence indicates cells in G1 phase of the cell cycle and expression of geminin-GFP showing green fluorescence indicates G2phase of the cell cycle [12]. It’s an advanced biomedical technique to monitor the individual stages of the cell cycle under live condition using fluorescent microscopy.
Premo FUCCI Cell Cycle Sensor BamMam 2.0
The two viral vectors consist of Premo geminin-GFP and Premo Cdt-1-RFP were introduced separately into the Hela and MDAMB 231 cell lines as previously described [13] (Figure 9). The two constructs were mixed prior to adding the solution in the cell lines. 40 ul of Premo Geminin-GFP is added to the 2 ml of culture medium (DMEM) in 12 well tissue culture plate. Cell culture medium was replaced with 2ml of transduction solution and cells were incubated for 2 h at 37ºC. Additional enhancer solution provided in the kit (1X BacMam) was mixed with fresh medium and finally added to the cells for further incubation at 37ºC. Fresh medium was given to the transduced cells followed by 16 h incubation at 37ºC.
Imaging with Spinning Disc fluorescent microscopy
The transduced cells under the influence trypsin gets detached from the cell culture plate and after 20 h transferred to 35 mm glass bottom tissue culture plate for imaging using spinning Disk 2.6-Image Processing software- Image J and Photo shop and movies were made using Xen-blue/black software. Time lapse images were captured after regular time point with the automatic setting parameters which attached to a colored camera. The imaging continued for 72 h post-transduction.
FACS analysis
In order to study the successful transduction efficiency of the Fluorescent probes in the cell culture, FACS analysis was performed as described earlier [14]. The minimum of 50% transduction efficiency was used as a threshold in FACS analysis that was further processed for the visualization under microscopy.
Discussion
Synthesis of In silicoG0specific transcriptional, translational reporter construct, gene editing using g RNA/Cas 9 construct targeting G0-specific human gene GOS-2
The most common biomedical approach used for the identification and quantification of cell cycle stages is FACS (Fluorescent Activated Cell Sorting) [67]. The duration of the individual stages of the cell cycle (G1/S/G2/M), their visualization and their temporal dynamics during transition dynamics could be achieved in a limited manner using FACS approach in the study of cell cycle biology. In order to overcome this limitation in the field of cell biology, FUCCI (Fluorescent Ubiquitination Cell Cycle Indicator) reporter system has been introduced to investigate dynamics of individual stages of the cell cycle where RFP fused to Cdt1 gene labels G1 phase cells(red) while GFP fused to geminin label cells in G2 phase (green). The intermediate stage of S phase cell shows yellow color while the M stage and quiescent cell (G0) remain colorless [68] (Figures 7 and 8).
There is absence of information regarding way to identify quiescent cell or G0 cell not even with FUCCI system. This review is first of its kind to address the question of approaching FUCCI like system for identification of quiescent cells which is proposed to be used in conjunction with the existing FUCCI system. The gene GOS-2 (GO/G1 switch gene 2) has been selected to be used for G0 specific assay based on its stage specific expression in the quiescent Figure 9. Snap shots of Hela cell live cell imaging is detected under the Florescent microscope (10X magnification). GFP fused to Geminin gene are shown to be express strongly specially only the cells in the G2 phase cells. (A) Weak green signal indicates S phase cells. RFP fused to Cdt1gene shows red color represents the cells in the G1 phase pf cell cycle. (B) The transition of G1 cells to S phase shown in the bottom panel where downregulation of Cdt1 gene is accompanied by upregulation of Geminin gene imparting a yellow color (D)The outline of the cell is shown with the bright field microscopy. 10X magnification with scale bar of 5 µm. phase of the cell cycle. As a proof of concept, an Insilico transcriptional G0 specific reporter system and In silico translational G0-specific reporter system has been introduced in this review (Figures 2 and 4). As there are limitation with In silico transcriptional assay, a more innovative In silico translational assay has been proposed as the later approach has the potential to consider the post-transcriptional modification associated with protein trafficking which is a critical feature in studying quiescent biology. Additionally, for investigating loss or gain of function associated with quiescent biology and G0-G1 transition, a g RNA/Cas9/GOS2 cloning system has been proposed, designed and developed that can target quiescent specific GOS-2 gene finally resulting in the frameshift mutation (Figures 5 and 6). In order to avoid the degeneracy of the genetic code, two exons were targeted inside the open reading frame (ORF) (Figures 5 and 6). Other G0 specific molecular markers should be examined further for the synthesis of both Insilico and In vivo/In vitro translational reporter assay.
Identification of potential transcription factor binding site, promotor motif identifier and locating enhancer and micro RNA regulatory element in 5’ & 3’ UTR region of G0-specfic GOS-2 genome
Using multiple software like EPD and PROMO, it was possible to identify potential functional promotor motifs, transcription factor binding site in the 5’UTR region quiescent specific GOS-2 gene (Figure S3 and Table 3). The presence of multiple promotor motifs like CCAAT-box, Initiator, TATA box (RNA polymerase binding site) and CCAAT-box were identified in EPD within -1000 to -100 bp relative to TSS (Figure S3). The analysis of promotor binding sites within -3000bp of the TSS might indicate the role of GOS-2 in multiple signaling transduction pathways. Presence of Transcription Factor Binding Site (TFBS) for factors like HOXD9/HOXD10 in GOS-2 promotor might indicate the role of TFBS in limb bud development as well as in Wilm’s Tumor. A lot of genes involved in T/B cell differentiation, Immunological response, cytokine development has been identified in the present analysis which includes c-Ets-1/2, Foxp2, RELA, SPI, LEF1, VDR, C/EBP- β, XBP, RBPJ, PAX-5, c-MyC, PU-1 etc. Few of the genes screened in this preliminary analysis present in the promotor region of GOS-2 has been implicated in Alzheimer’s disease and colorectal tumor like ENKTF1, Retinoic acid receptor-RXR α, ETS like 1 protein ELK-1 (Table 3). The above preliminary promotor analysis of quiescent cell specific molecular marker (GOS-2) gene could be used as a template for further investigation for the role of GOS-2 gene and subsequently its role in G0/G1 transition and its pathological correlation with multiple diseases like Pitts-Hopkins syndrome, Osteosarcoma endometrial carcinoma, Multiple sclerosis etc. (Data not shown but could be send if interested). The enhancer plays an important role in the regulation of gene expression and as the present gene under review GOS-2 is involved in G0/G1 transition, it is very crucial to understand and locate the enhancer region within the promotor region of the gene. Using UCSC genome browser and EPD software, identification of potential location for the presence of the enhancer was examined. Typically, in Chip-Seq analysis, presence of peaks associated with H3K4me1 and H3K27ac is considered as good indicator for the presence of the enhancers. For GOS-2 gene, 5 potential regions have been located within the genome that could be further studied In silico and In vitro for its role in the spatio-temporal regulation of GOS-2 expression and its association with G0/G1 transition. The process of transition of different phases of the cell cycle including G0/G1 conversion is associated with alteration of gene expression profile involving activation/repression of stage specific transcription factors. The 3 ‘UTR are a potential site for the presence of micro RNA regulatory elements (MREs) that are involved in the repression of the transcript. Using Target Scan Human, the predicted micro target site was identified in the 3’UTR of GOS-2 gene (222bp-228bp) (Figure 8a). Cross-species comparison of the MREs was done and the sequence conservation is highlighted across multiple species (Figure 8b). This observation is important and miRNA target region has to be considered at the time of designing the translation reporter construct specially with GOS-2 gene where 3’UTR is a critical part of the GOS-2-Translational reporter construct. The present approach for the generation of GOS-2 translational reporter assay has its own limitation as the potential protein coding region to be ubiquinited for the degradation process during G0/G1 transition has not be considered which needs further detailed sequences analysis both in transcript level and in protein level.
Limitation of presently available NATC agents against tumor
The NACT approach mainly comprised of surgical intervention, chemotherapy along with use of chemoradiotherapy [42,43]. As the present review focuses only on the management of the NACT agents dealing with the DRCs, discussion of other approaches is beyond the scope of this review. A list of widely used neoadjuvant, adjuvants and antimitotic have been described (Table 4). The use of these drugs considerably reduces the extent of the recurrence of the tumor [18,20]. The most widely used mechanism used by these drugs include acting as alkylating agent, methylating agent etc. (Table 4) hampering DNA replication, DNA transcription and protein translation. Similarly, in the case of different types of brain tumor, the drug target identical mechanism but few of them are more cell type specific targeting G1 phase cells (e.g. vatalanib) or metaphase (vincristine) (Table 3).
Limitation of the NATC drug development strategy against tumor relapse proposed and predicted in this review
The genes and mechanism proposed here to be used as drugs and drug target for to be investigated as potential Neo-adjuvant chemotherapeutic (NACT) agent against recurrence of the tumor has its own limitations as described below-The analysis is cross-species (Go specific gene expression and their potential role might differ from species to species and it has to be examined properly), tissue specific modality (e.g., neurotransmitter might act as pro-proliferative factor in tumors arising in macroscopic tissue specific manner), differential response to the potential NACT drugs (Go cells might respond differentially to the potential drugs proposed that is open for further investigation). Translational reporter assay is more informative than transcriptional reporter assay and translation reporter assay needs further detailed sequence analysis to examine the implication of ubiquitous degradation pathway. Use of G0 specific genes other than GOS-2 has to analyzed to be for G0 specific reporter assay. Comparison of whole genome transcriptome analysis between cells in the G1/S/G2/M and G0 cells under the regulation of growth factors would help us better understand the up-regulation/down regulation of genes associated with the G0/G1 transition.
CONCLUSION
A slight decrease in the rate of the tumor recurrence process aided by potential novel NACT agents can have drastic effect in the life span of recurring tumor patient.19 potential novel NACT drugs and drug target mechanism identified in this review is open for further investigation in In silico, In vitro and In Vivo setup. First time In silico synthesis of transcriptional and translational reporter construct associated with G0/G1 transition has been described that can be used along with already existing FUCCI reporter system for better understanding of G0/G1 transition process. The identification of transcriptional binding site and list of transcription factors of G0/G1 transition human GOS-2 gene along with identification of its potential enhancer, promoter motif, micro RNA regulatory elements and In silico design of g RNA/Cas 9 -GOS-2 quiescent specific mutant construct can trigger molecular studies associated with G0/G1 transition that might improve the therapeutic approach against tumor recurrence [69-78].
ACKNOWLEDGEMENTS
The author would like to thank the previous institutions that was instrumental in providing guidance and training. Institute of Genetic Medicine, Newcastle University, UK; Medical school, Virginia University, USA; CCMB-CSIR, India; IIT-Kanpur; IIT-Bombay and ICMR-RMRC. The authors would like to appreciate Dr Hiroyuki Miyoshi for sending the plasmid pCSII-EF-MCS.The authors would like to acknowledge the central facility of Live cell imaging facility of Spin Disc Fluorescent Microscopy in BSBE, IIT-Bombay. The tissue culture and FACS analysis was helped by Sushant Kumar, Atharva Karulkar and Vinodhini Govindaraj. The author would like to appreciate the help of faculty from Dept. of Chemistry and BSBE, IIT-Bombay for their support.
AUTHOR SUMMARY
Project Scientist- RMRC- ICMR-Indian Council of Medical Research, India. Post-Doctoral Fellow-Laboratory of System Biology, Department of Chemistry, Indian Institute of Technology-Bombay, India and Laboratory of Immunoengineering, Biosciences and Bioengineering, IIT-Bombay. Post-Doctoral Fellow-Laboratory of Developmental Biology and Neurobiology, Biological Sciences and Bioengineering, Indian Institute of Technology-IIT-Kanpur-India. Research Associate -Laboratory of Molecular Genetics, CCMB-CSIR, India. Teaching Fellow/Research Associate. Laboratory of Developmental Neurobiology, Dept of Cell Biology, Medical School, Virginia University, USA. Research Associate. Laboratory of Human Developmental Genetics, Institute of Genetic Medicine, Newcastle University, UK Author's contribution - Conceptualisation, experimentation, analysis, interpretation was done by Subrotsarma.Manuscript writing, editing, draft preparation, software Analysis was done by subrotSarma. Additional experimentation was done by Jalandhar mahato, Vinodhinigovindraj and Atharva karulkar.Funding - DBT and DST Availability of data and material - Supporting data could be provided on request to subrots6@gmail.com Consent for publication - The author declares consent for publication along with consent from the Dean and Director of the IIT-Bombay to publish this manuscript (scope review). Competing interest - None Authors ' information - Research Associate (Newcastle University,UK Teaching Fellow -Dept of cell biology, Virginia University,USA, Invited Associate - CCMB, IIT-Kanpur, IIT-Bombay,ICMR-India.
 Table 1